
The Insights report answers the question “why is our data dirty?” It brings together duplicate creation trends, source attribution, recurrence tracking, and data quality scoring in one place, so revenue operations teams can find the root causes of data quality problems instead of only treating the symptoms.
What the Report Shows
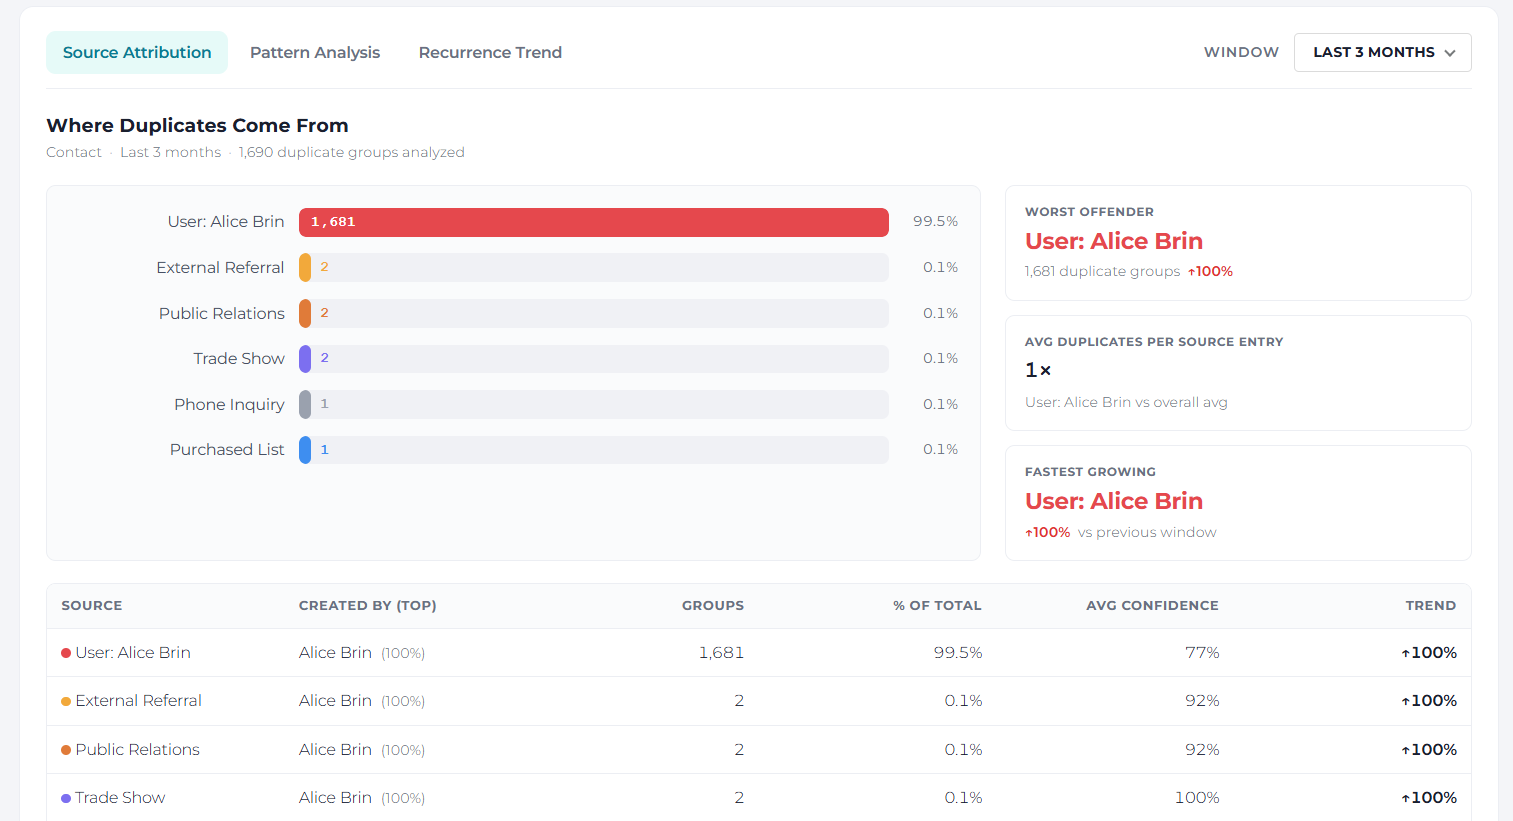
- Source Attribution — which record sources (Lead Source, creating user, or integration) produce the most duplicates, aggregated from matched group metadata. Use it to identify where to fix the pipeline.
- Revenue Exposure — duplicate records linked to open Opportunities, quantified by pipeline value. This converts data quality from a hygiene story into a revenue protection story.
- Data Quality Score Trend — the object-level Data Quality Score (A–F) over time, providing an executive summary of whether data health is improving.
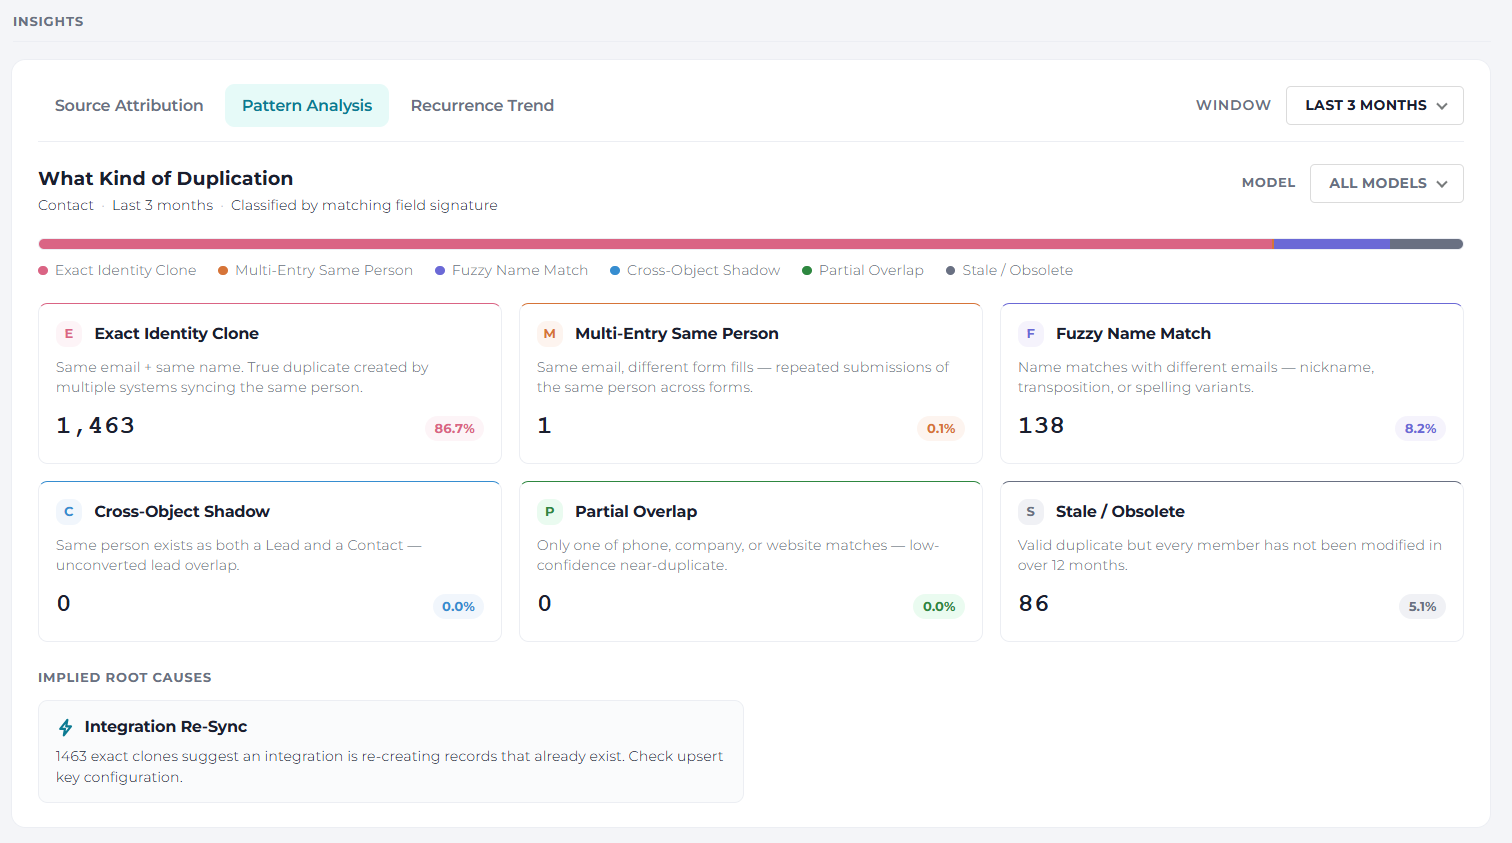
- Duplicate Pattern Distribution — matched groups categorized by match type, showing which duplicate patterns are most common in your org.
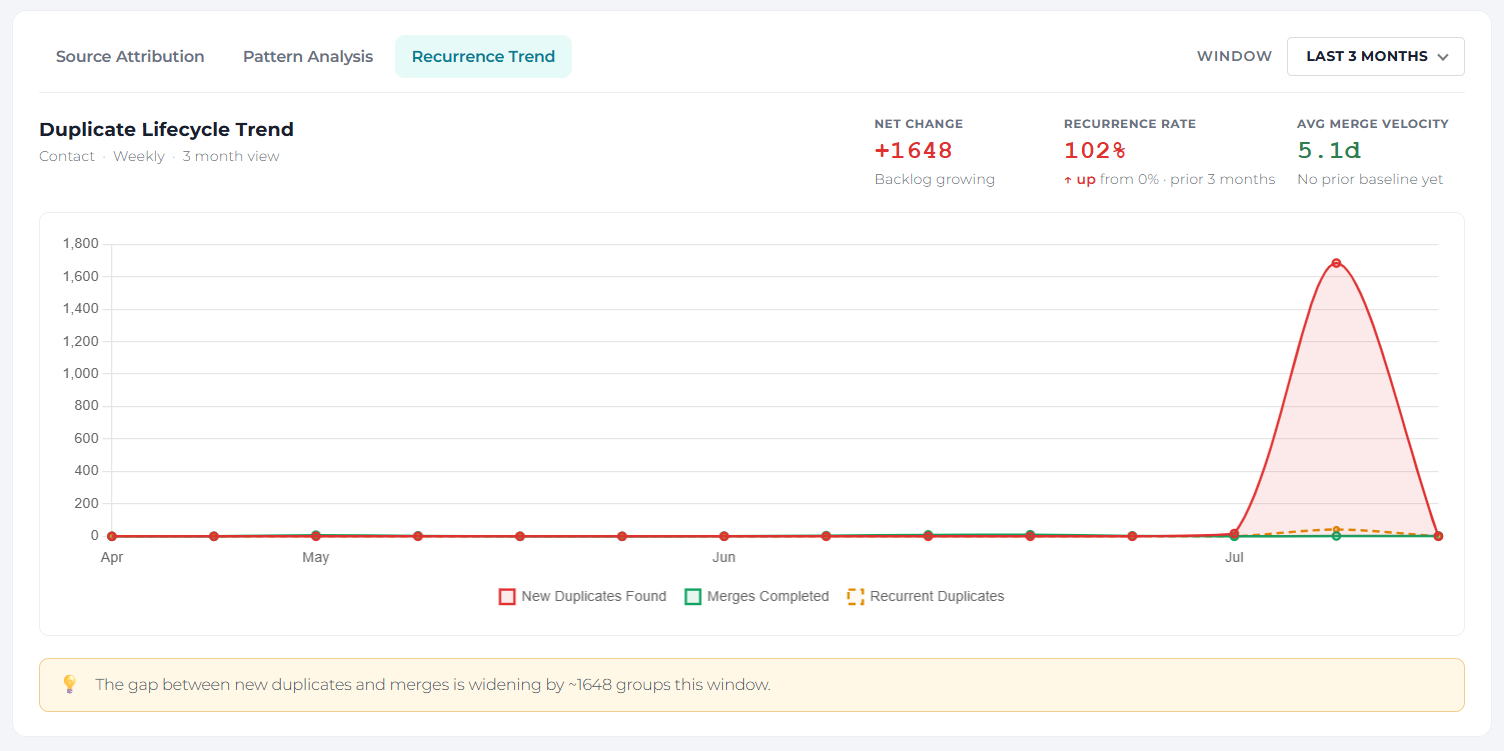
- Duplicate Creation Rate — new duplicate groups discovered per analysis run, trended over time. This is the clearest signal of whether your data quality is getting better or worse.
- Recurrence Rate — the percentage of duplicate groups that reappear within a set number of days after being merged. A high recurrence rate means the root cause is still unresolved.
How to Use It
- Review the Duplicate Creation Rate trend to understand the overall direction of your data quality.
- Use Source Attribution to identify the users, sources, or integrations creating the most duplicates.
- Check the Recurrence Rate to confirm whether merges are solving the problem or duplicates keep coming back.
- Use Revenue Exposure to prioritize cleanup where it protects pipeline value.
Learn more: the Data Quality Dashboard article describes the other reporting views available in DataGroomr.